We’ve created this page with one purpose, to give you real-time perspective on all of the current years products (for your sport). It’s so easy to get caught up in new releases and forget how they compare to the other releases. We want to make sure you are ALWAYS aware of the total breakdowns of each checklist. Bookmark this page and come back a few days after a new release. This will continue to be updated.
Updated: March 2nd, 2018 . (added Panini Select + Contenders)
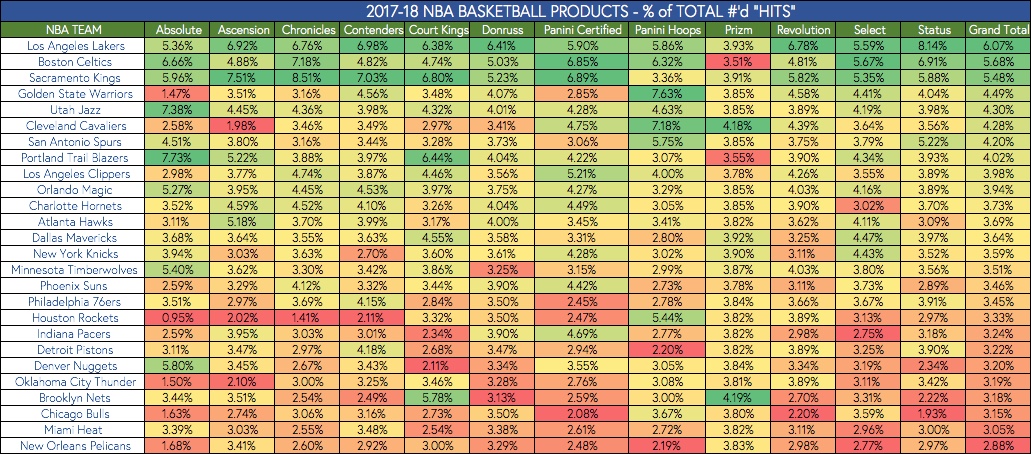
#1 – Total % of Hits across each product.
We define a “hit” as any #’d card. So this looks at all of the #’d cards across each product and compares it against the field. We’ve then color coded the fields so you can quickly reference which product is best/worst.
For example, you have a 7.63% chance of pulling a Warriors #’d card out of NBA Hoops.
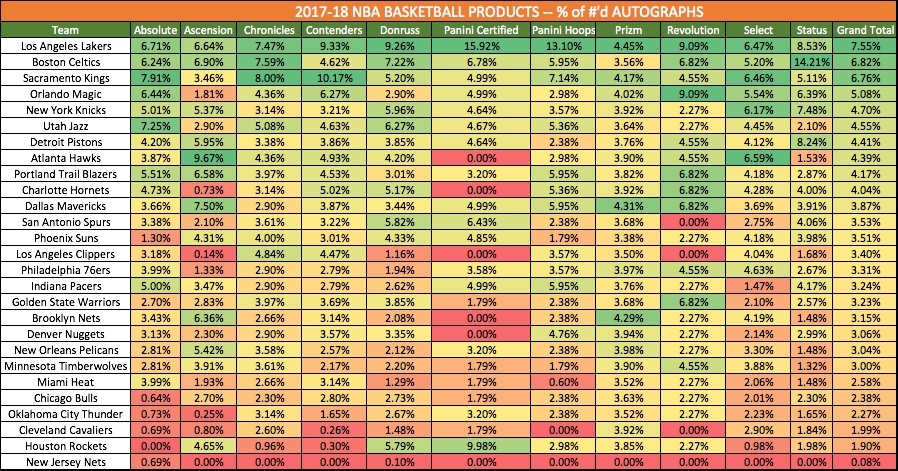
#2 – Total % of Auto’s across each product
This is similar to the chart above, but it ONLY looks at #’d auto’s. We’ve also color coded these to make it an easy reference.
For example, if you pull an auto out of Prizm basketball there is a 4.29% chance it’s a Brooklyn Nets auto (2nd highest!).
- Status is LOADED with Celtics #’d Autographs.
- Atlanta Hawks have THE MOST #’d autos in Panini Select Basketball.
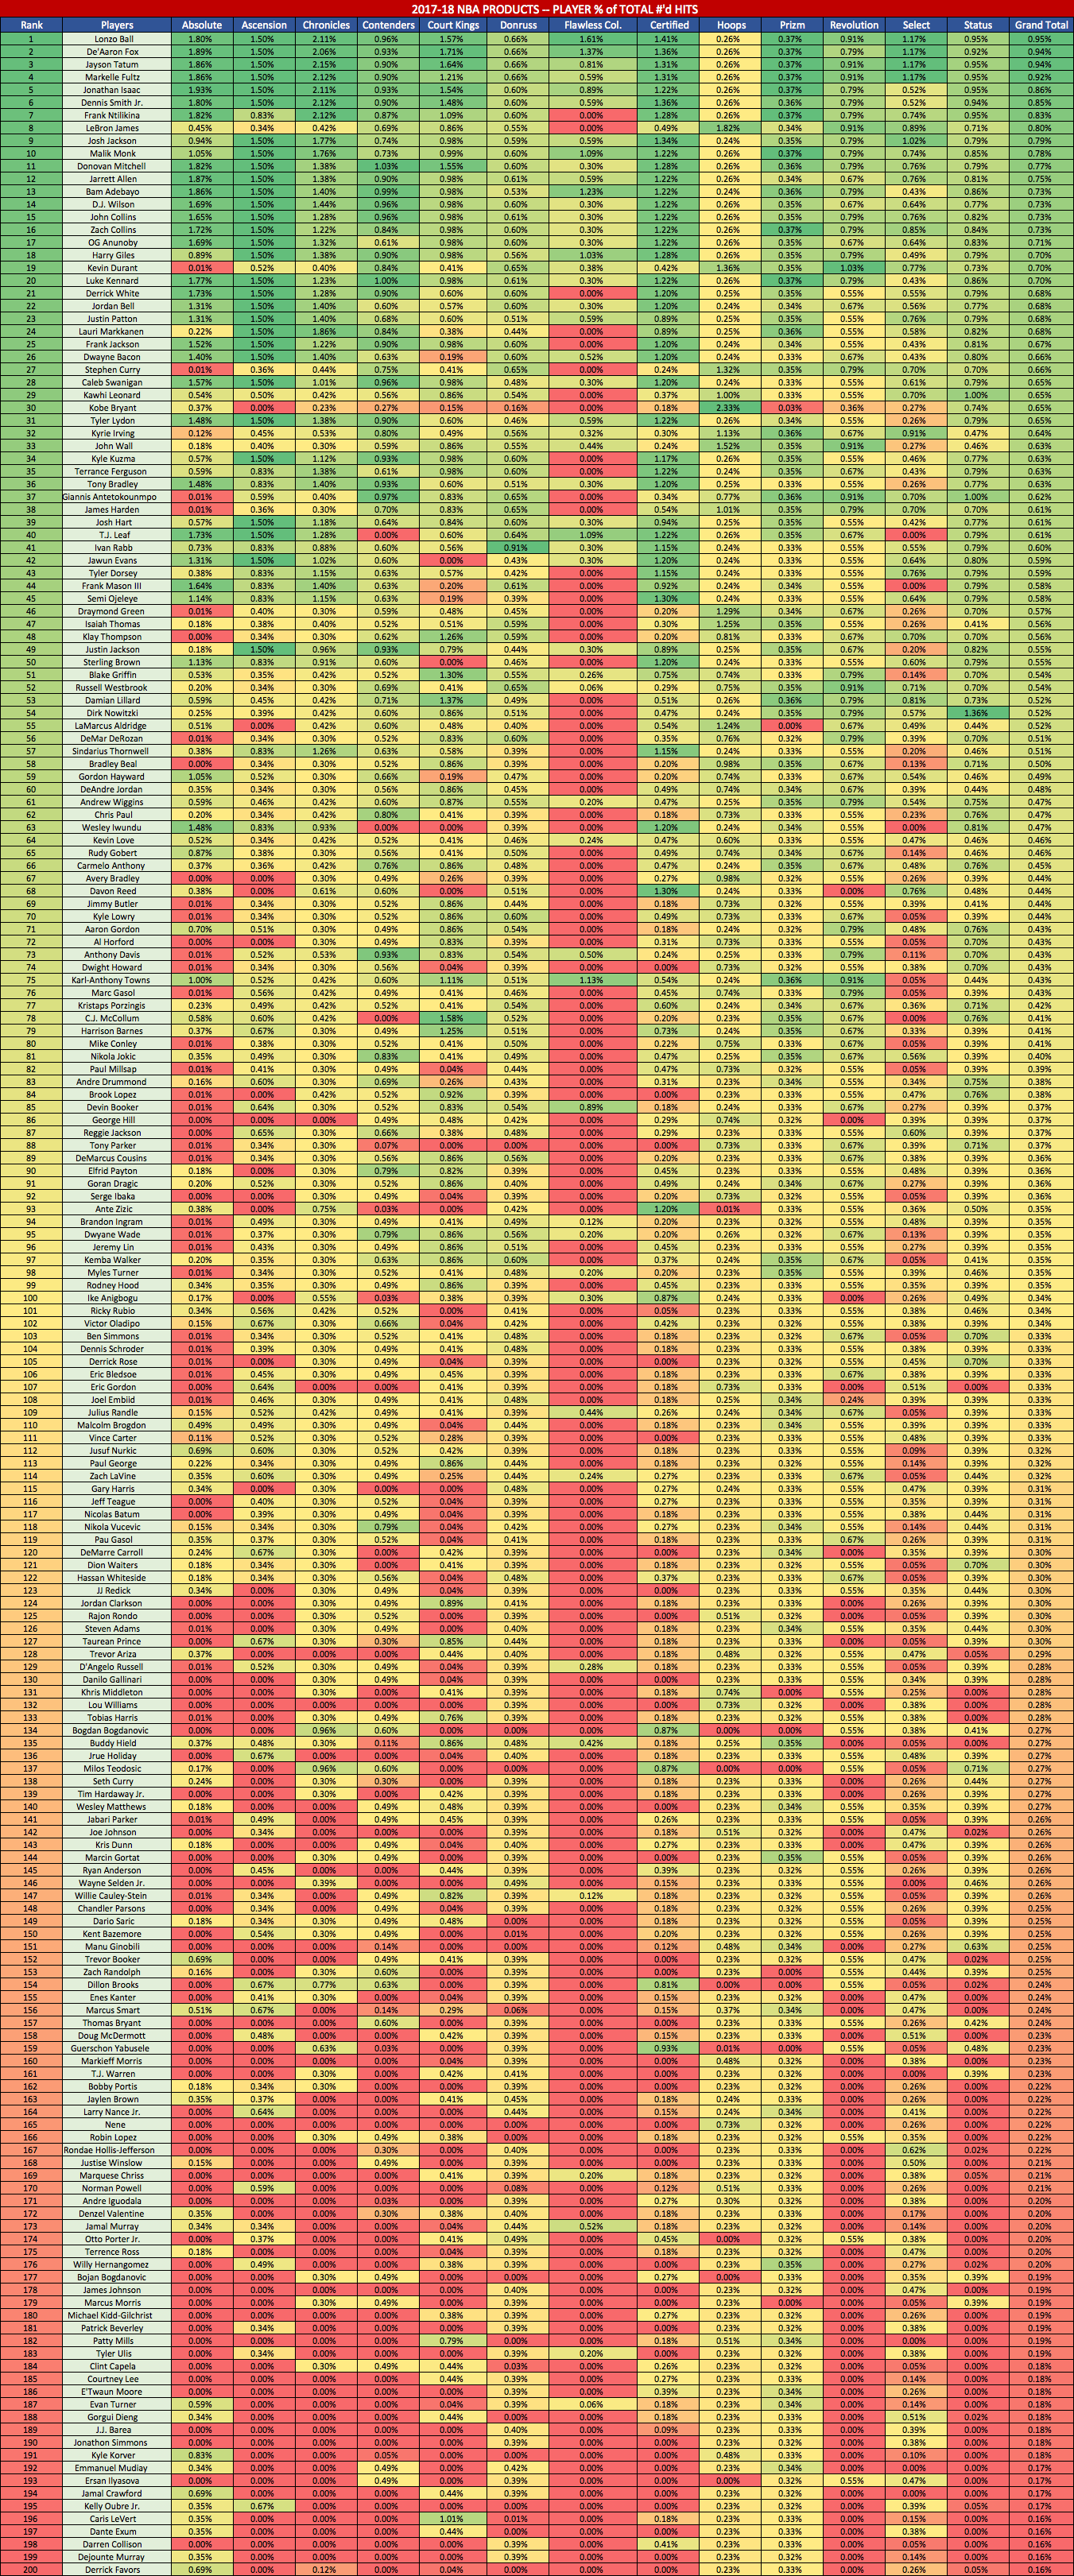
#3 – Total % of HITS across each product — For Top 100 Players
We define a “hit” as any #’d card. So this looks at all of the #’d cards across each product and compares it against the field. We’ve then color coded the fields so you can quickly reference which product is best/worst.
For example, in NBA HOOPS you have a 1.36% chance of pulling a Kevin Durant #’d card (Top on list!).
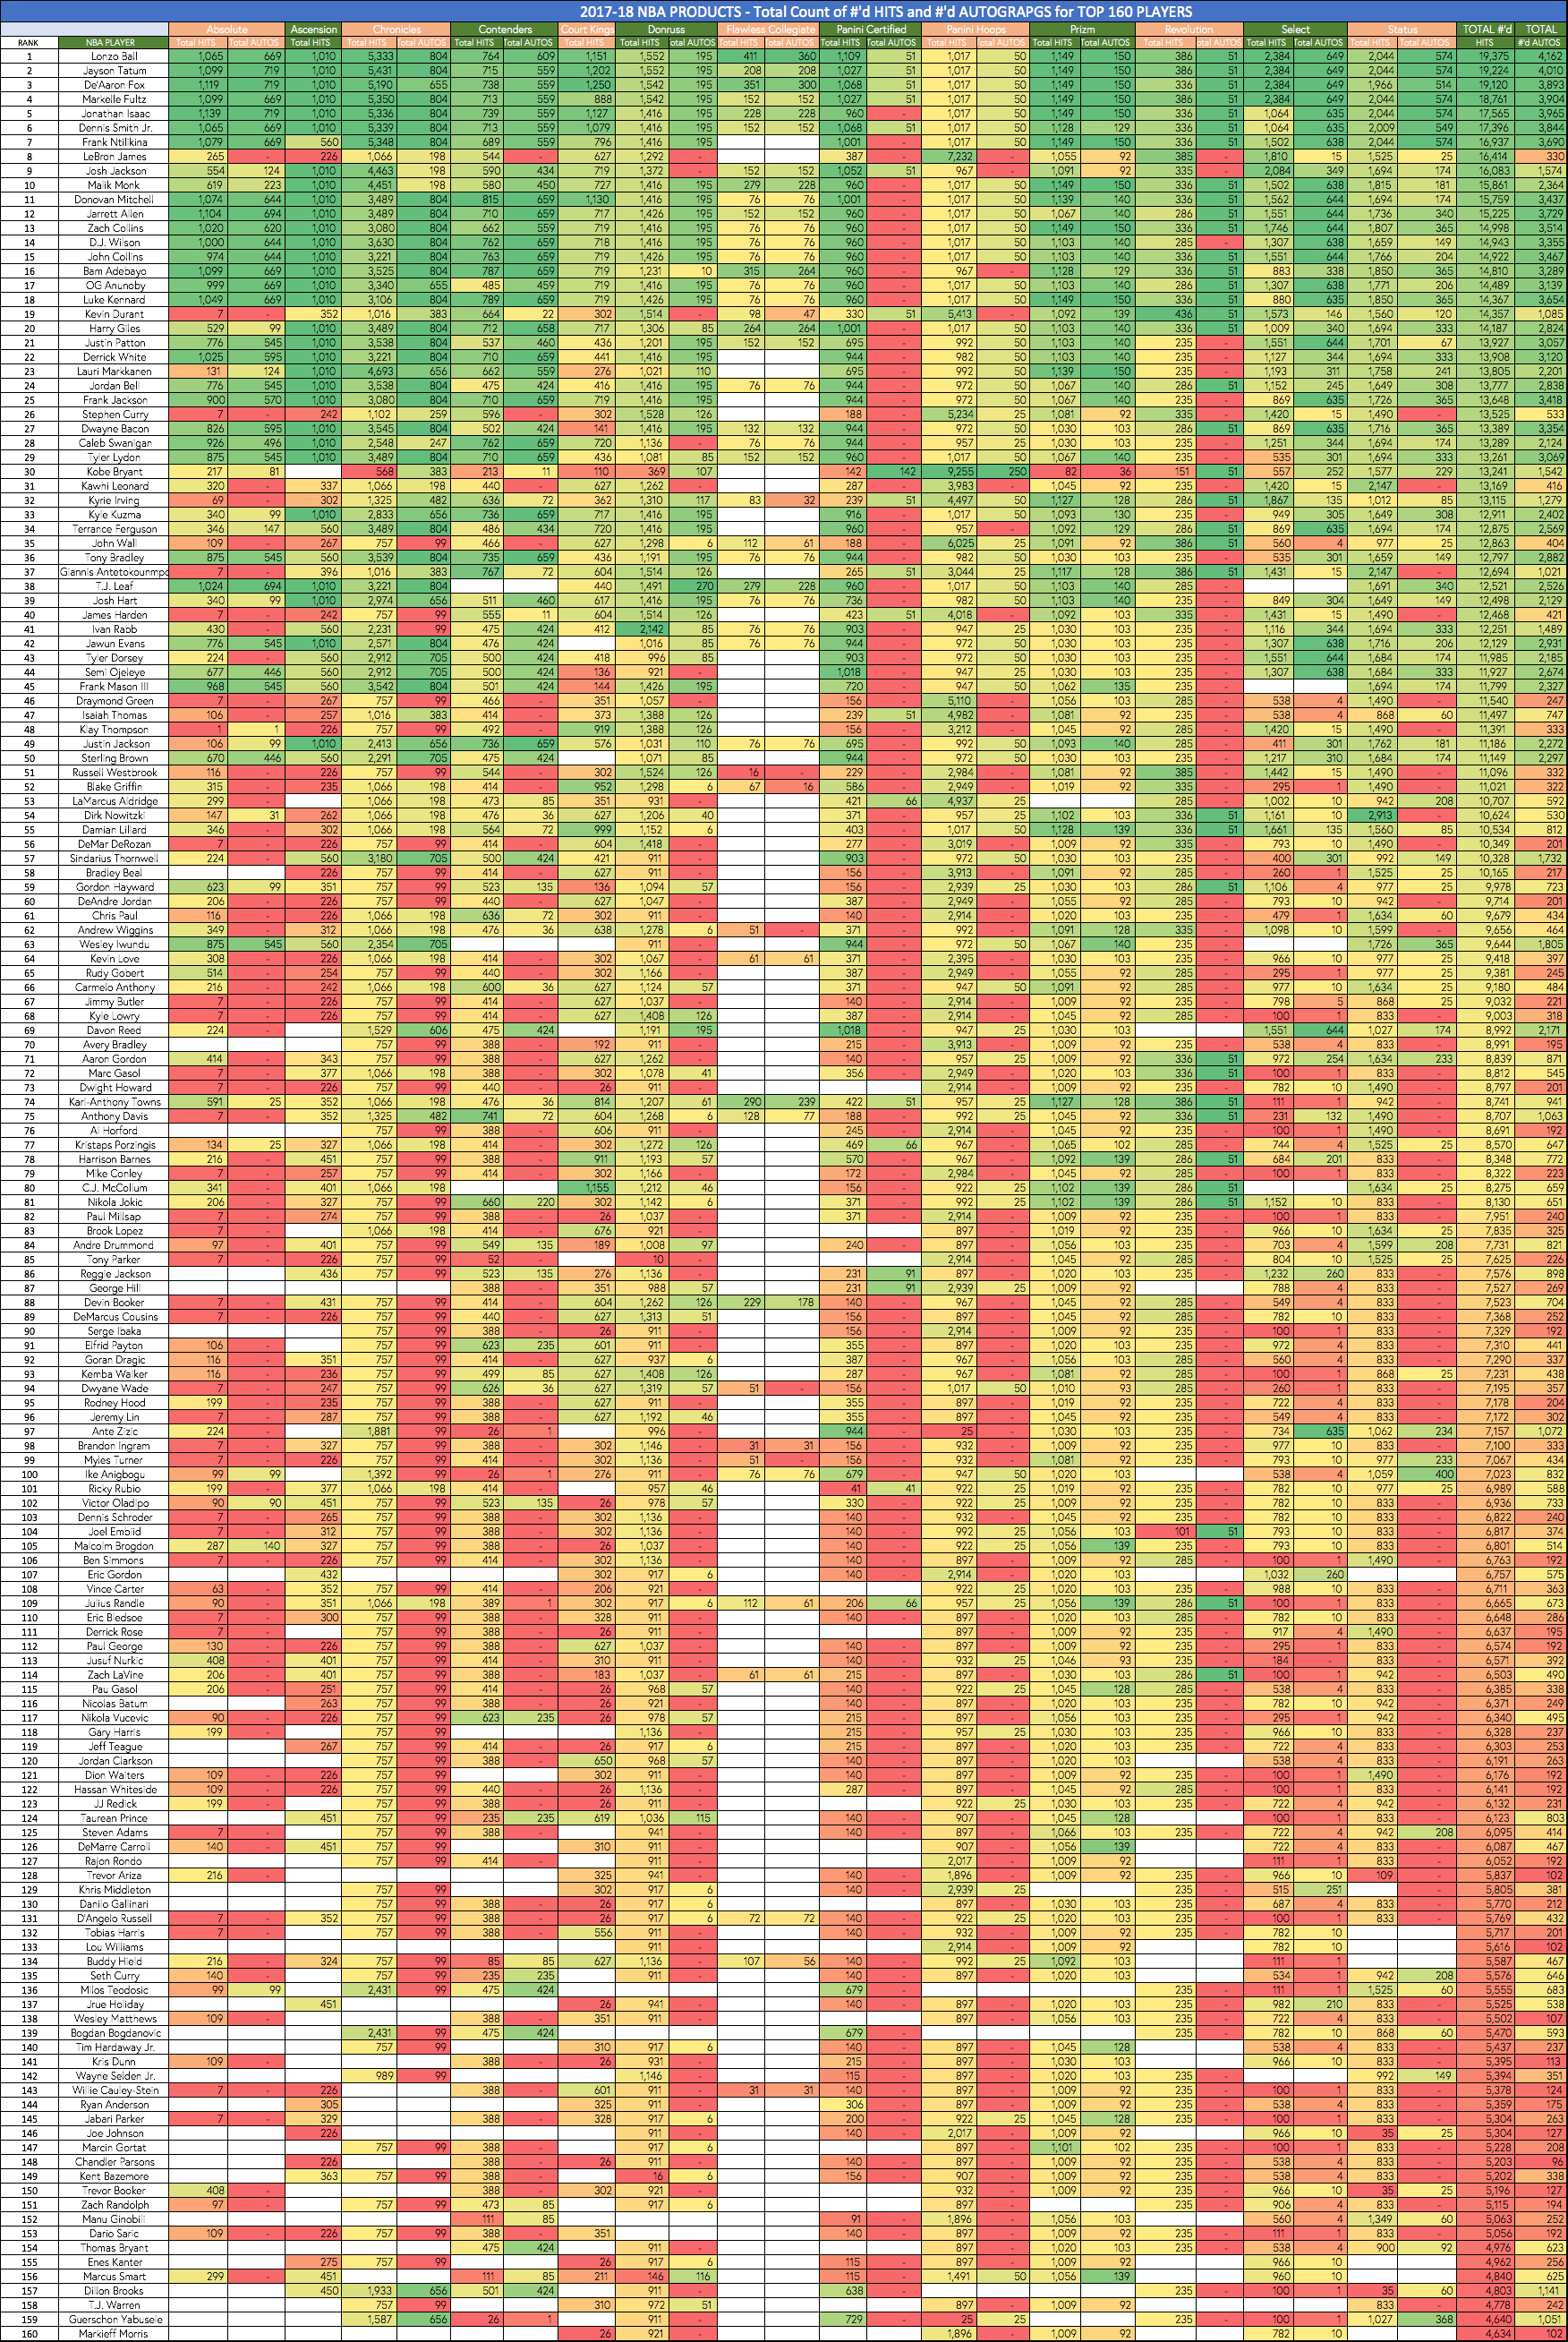
#4 – Total # of HITS & AUTOGRAPHS PER PLAYER across each product
This is similar to the chart above, but it shows an actual COUNT of the # of #’d hits and #’d Autographs. It’s a massive image, but it gives you everything. Top 160 is included.
Hope this is helpful! Let us know if you like it…so we can keep investing time into resources that you like!
Twitter: @breakerculture
Facebook Group: RIGHT HERE
Instagram: HERE

